DYNAMOX
Rely on Dynamox’s ecosystem to perform predictive machine monitoring combined with data intelligence tools.

Why is Dynamox wireless monitoring the way to go?
Machinery protection and the ability to gather information from hard-to-reach spots.
Frequent and automated data collection that is cloud-stored and visualized in detailed and comprehensive reports.
Quick sensor deployment and low maintenance when compared to wired monitoring.
Flexible monitoring platforms that ease your access to reports and data. Allowing safer working environments for employees.
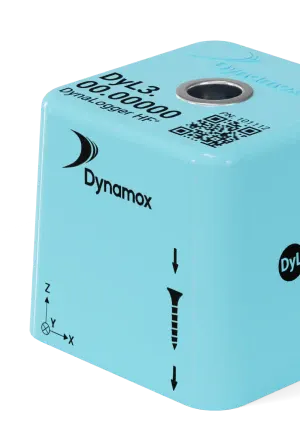
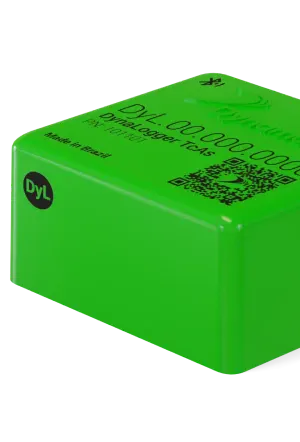
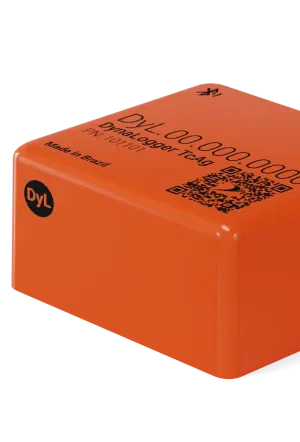
Dynamox sensors
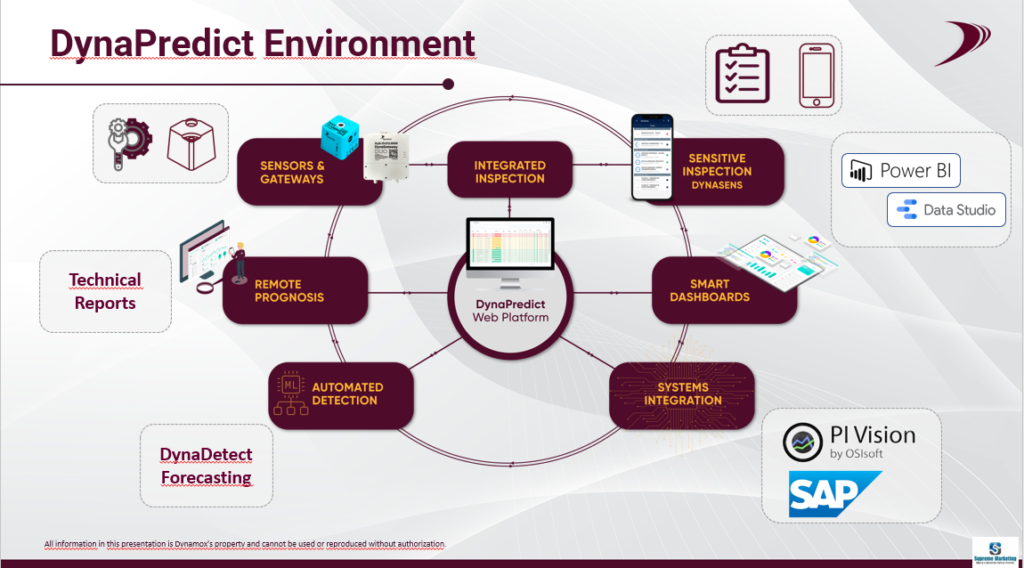
Dyna Predict Environment
The DynaPredict Environment is a comprehensive solution that includes the DynaLogger, which monitors machine health by collecting vibration and temperature data, an application for data collection and analysis on the shop floor, and a Web Platform with historic data and diagnostic tools for in-depth analysis. It’s designed to enhance predictive maintenance and improve overall equipment efficiency.


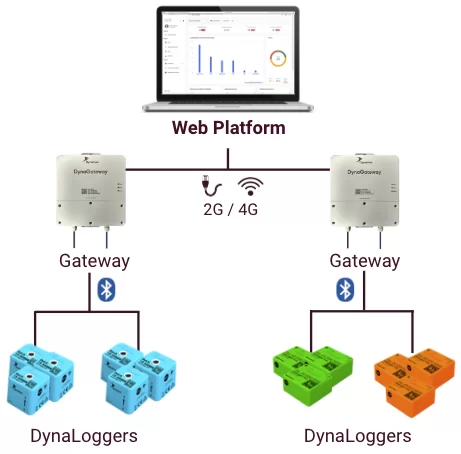
Dynamox Gateway – Automated Detection
The Dynamox Gateway device allows automized communication with DynaLoggers that sends the collected data directly to the Dynamox Web Platform using Mobile Networks, Ethernet, or Wifi.
Read more about the DynaGateway DUO’ ‘s Specifications by downloading the specification sheet.
Advanced tools for temperature and vibration analysis on the Dynamox Platform
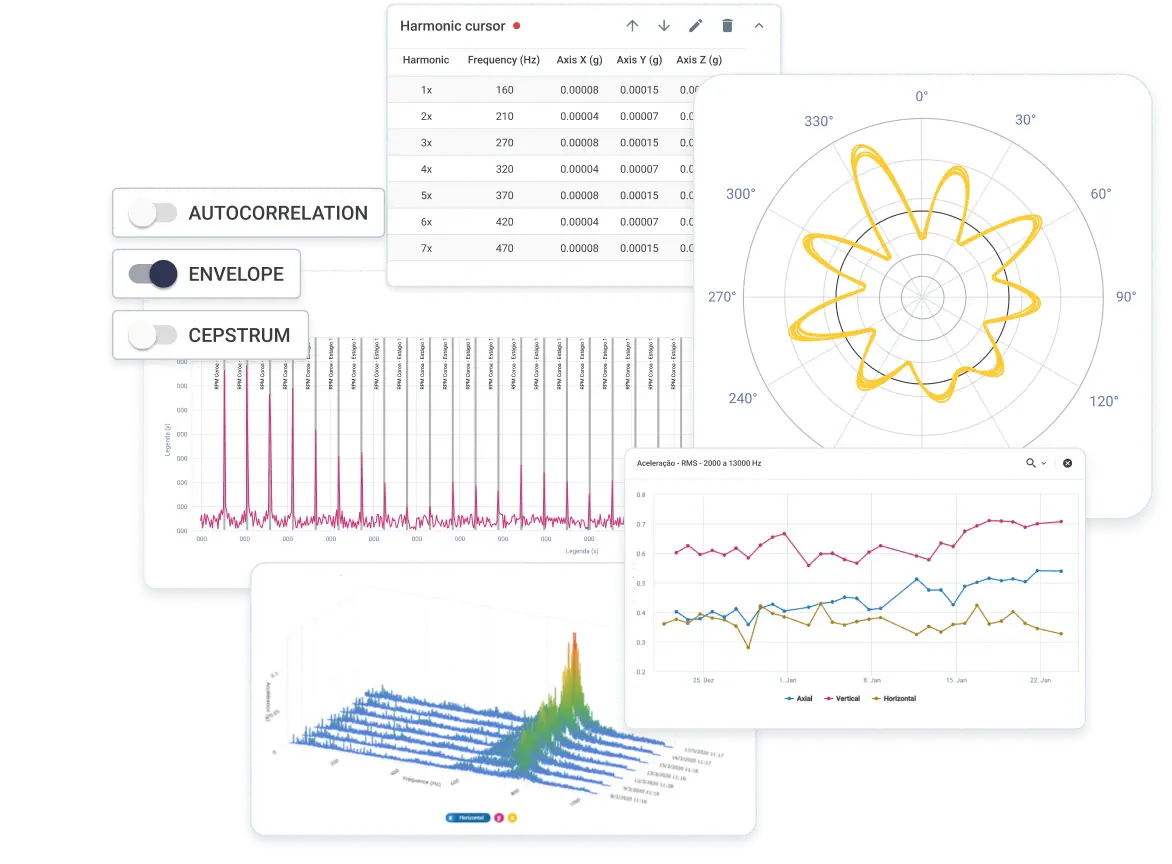
Historical data graphs
Waterfall spectrum
Alert Notifications
Autocorrelation
Spectrum Averages
Frequency Markers
Cepstrum
Envelope Charts
Measurement Comparisons
Make reliable and traceable records of your inspection routines
With DynaSens, field-collected data becomes a precise and reliable source for informed maintenance decisions.
- Customizable checklists: Gain autonomy and flexibility with customizable checklists suitable for inspecting different types of assets.
- Route Organization: Configure the assets, users, and the frequency of routes that you want to run, as well as the order of checklists and collections.
- Platform indicators: Record route information offline in the app and view indicators, history and alerts on the web platform.
Specialist dashboards for assets
Follow up on specific metrics for each type of asset and increase the efficiency of the maintenance process and the reliability of the plant.
- Frequent updates based on customer feedback and practical experience.
- View asset metrics in a managerial and technical way for decision-making.
- Alarm values are established based on field studies and years of experience.
Failure detection supported by AI
DynaDetect combines the expertise of our engineers with artificial intelligence to generate automated and responsive diagnoses.
- Specialist models, with proprietary algorithms, trained through historical data and user feedback to detect signs of failures.
- Automated failures detections that optimize team work.
- Instant and responsive diagnoses, right from the first spectral.
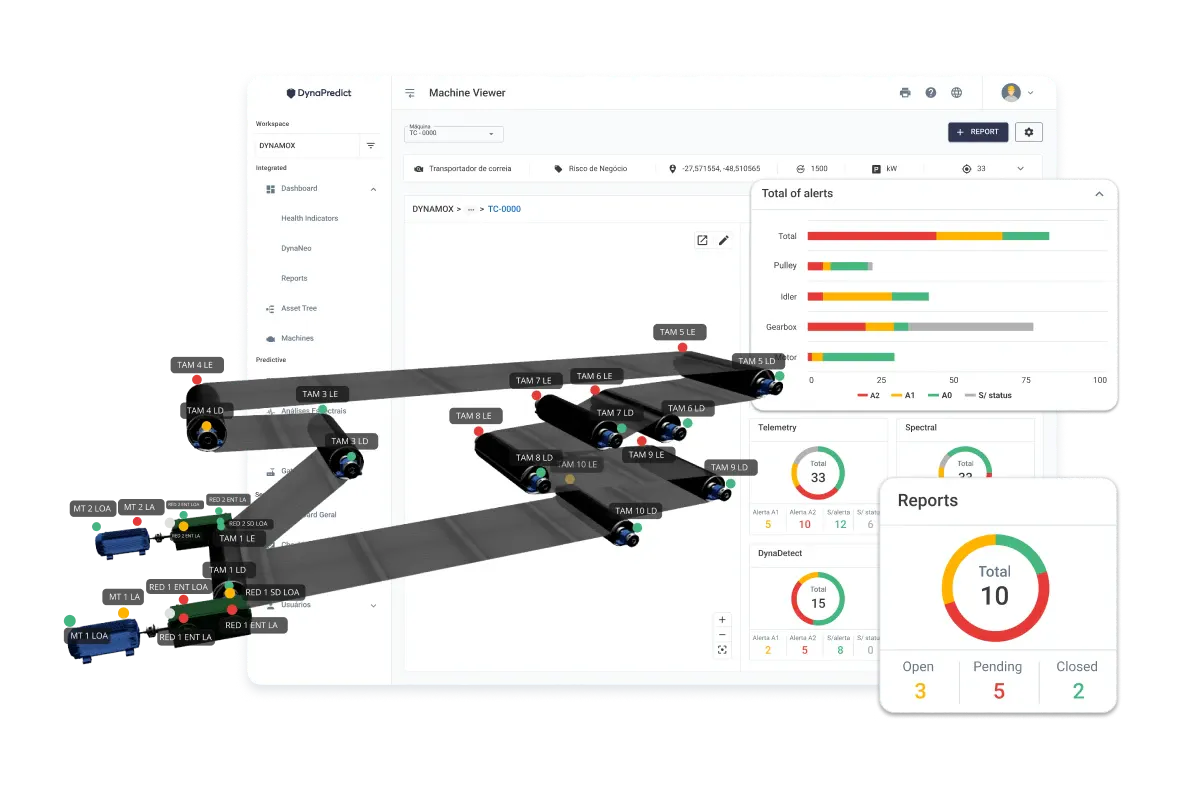
Dashboard to manage maintenance priorities
Visualize the health data of your maintenance process in a single dashboard with DynaNeo.
- Select the relevant assets and indicators to build your customized flow.
- Predict downtime consequences by analyzing the process as a whole.
- Quickly find alarmed assets and identify where you need to act.
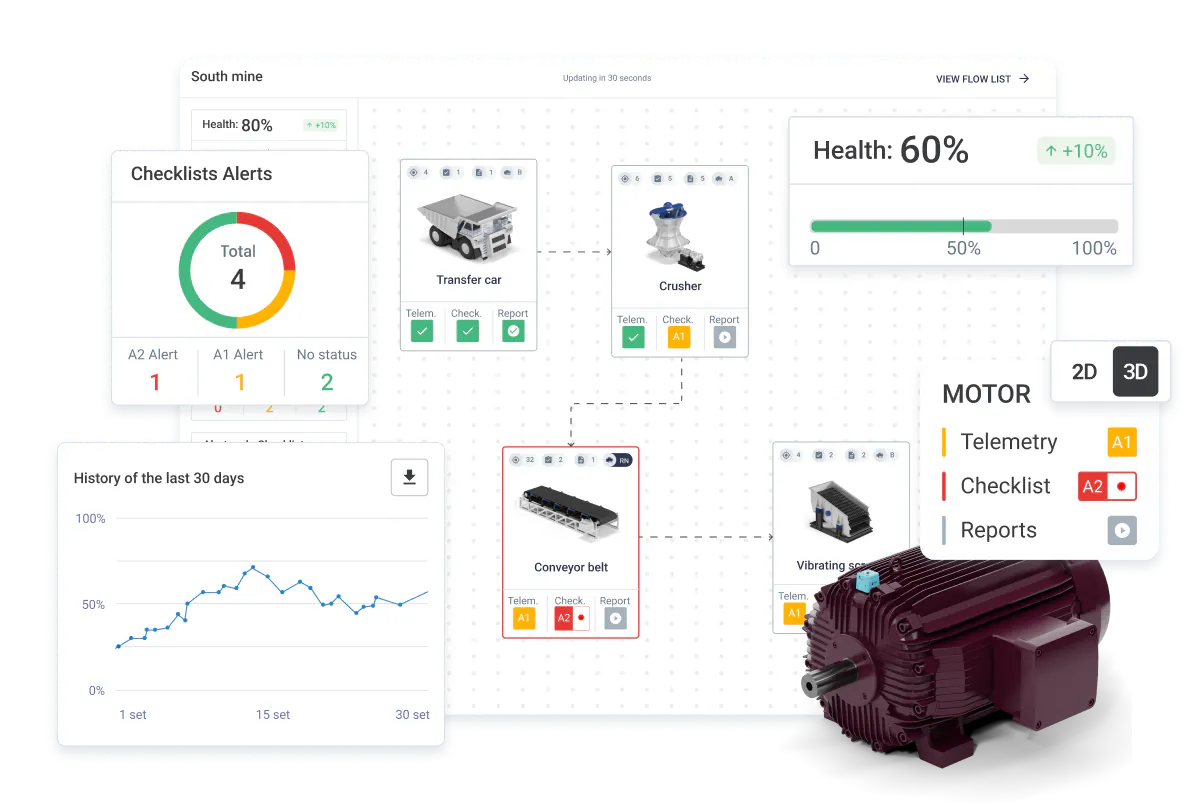
Alert Predictability
Access alert predictions and telemetry data projections to plan assertive maintenance actions.
- Telemetry data prediction tools and spectral metrics.
- Date predictions until reaching A2 alert.
- Inspection reports and checklists to record and follow up asset history.
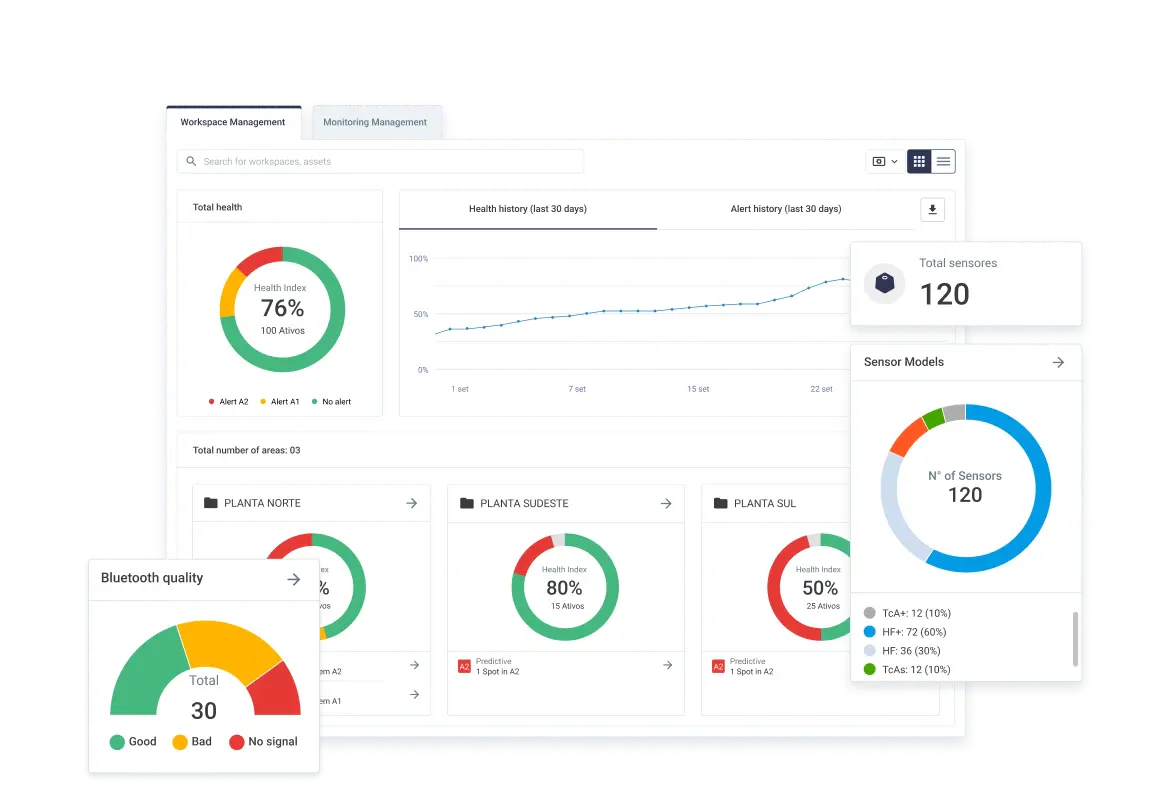
Track your plant’s health and manage asset monitoring
A comprehensive view of your plant on a dashboard that synthesizes alerts into health indicators, in addition to asset monitoring data.
- Track the temporal evolution of plant health data
- Compare work areas and monitor trends
- Visualize monitoring infrastructure data
Remote monitoring and prognosis
Dynamox’s team of specialists sends out monthly reports and continuously monitors the previously defined monitoring parameters so that, in the event of alerts, the customer is immediately notified and maintenance is carried out.
Autonomy to use monitoring data
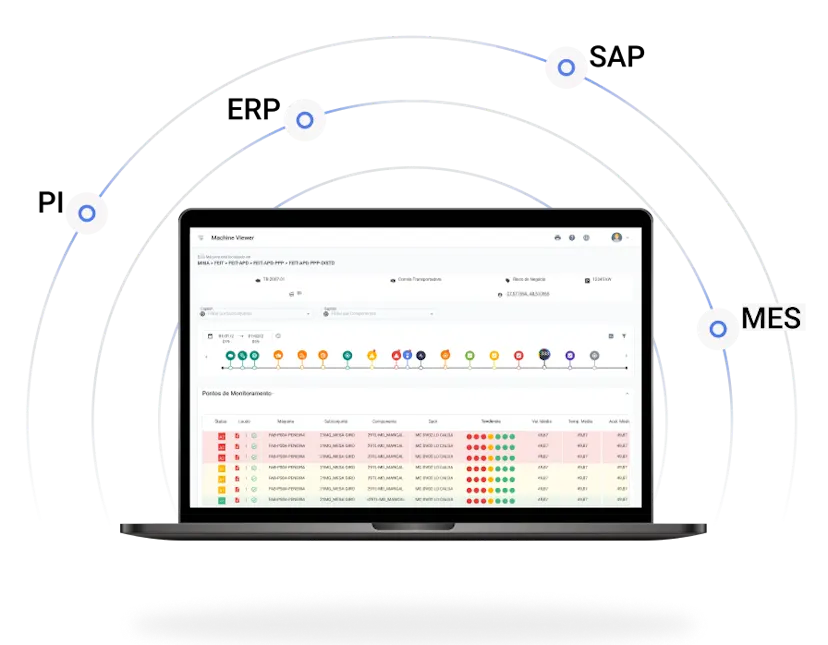
The integration module converts the raw data collected via Dynamox’s sensors into various formats, facilitating integration with other platforms and tools.